Do you want a resource friendly program to keep an eye on your computer's hardware? You should give Sidebar Diagnostics a try.
It is a free and open source application. When you install the program, it adds a side-bar to the right side of the screen that displays data from five core hardware monitoring tools: CPU, RAM, GPU, Drives and Network.
The sidebar display ensures that the readings are available at all times on the desktop. If you prefer a standalone program with its own window, check out alternatives such as HwInfo, Windows Resource Monitor, or SpeedFan (for controlling temperatures).
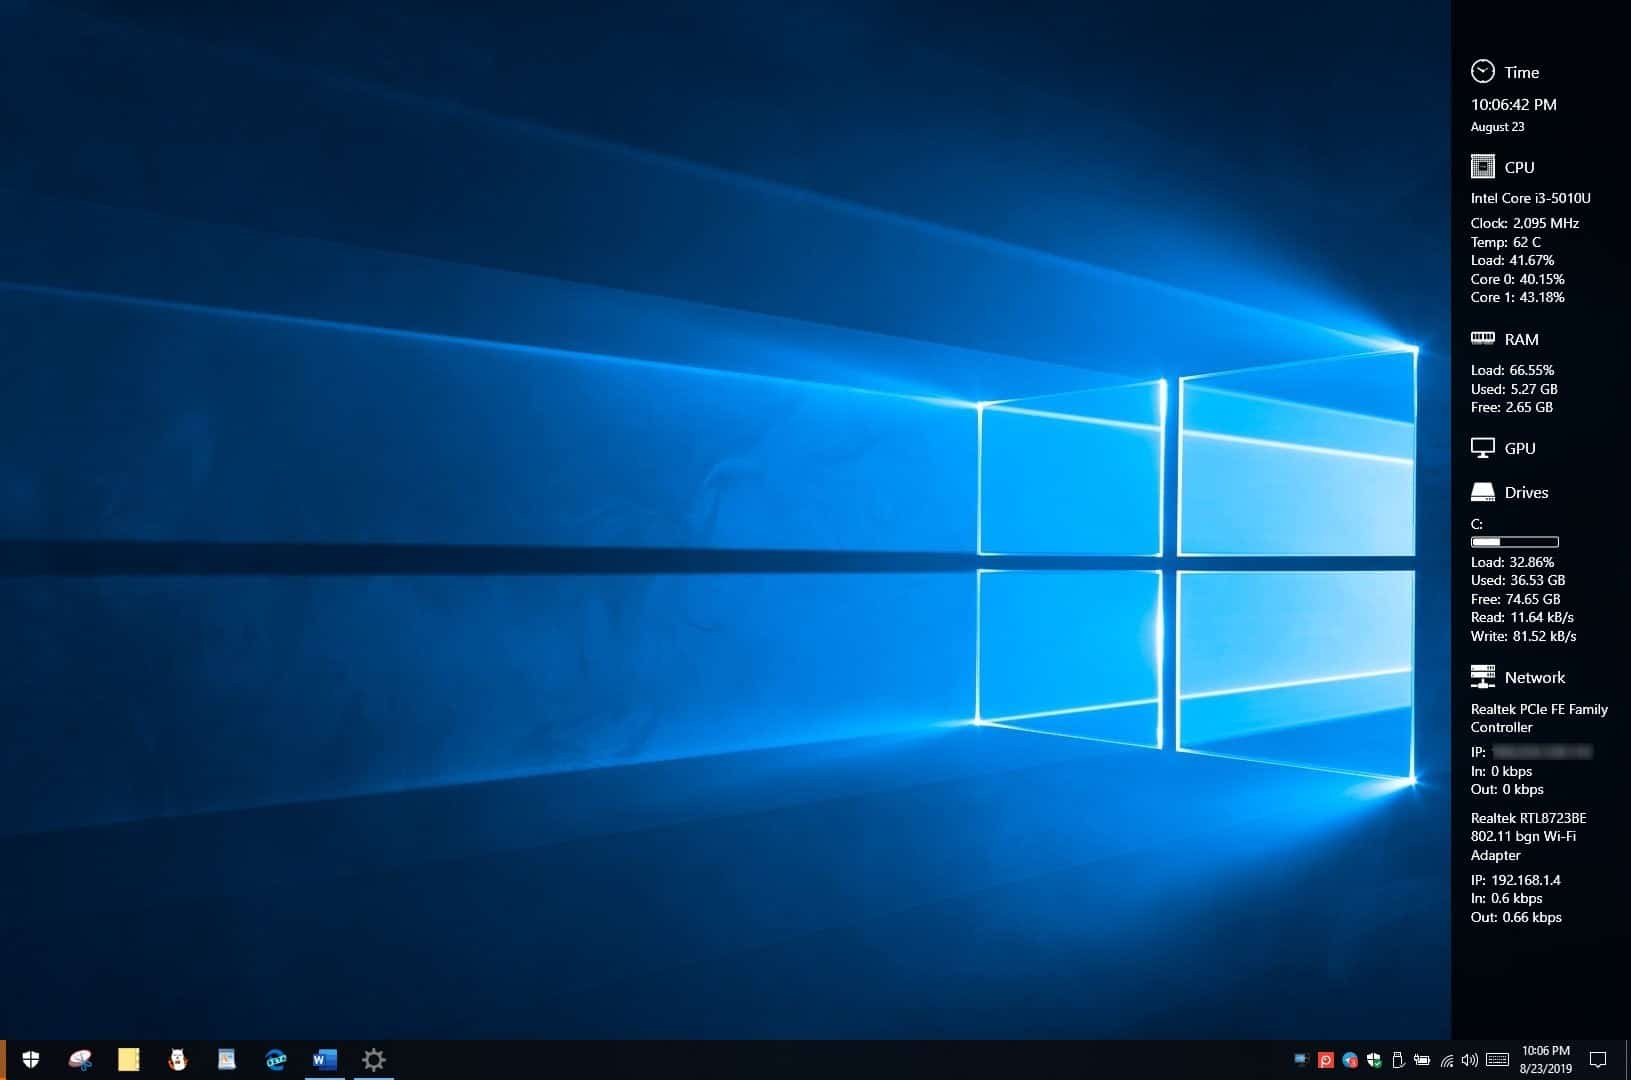
The program displays details for each of these monitors, e.g. the CPU's core clock speed, temperature, load (in %). Likewise the RAM monitor displays the amount of used memory and free memory. The Drives group has a bar that indicates the amount of used storage, and so on. There is also a clock on the top of the sidebar which displays time and date.
Move the mouse over the sidebar and you will see three icons at the top of the screen: Graph, Settings and Exit. Click on the graph to view a visual representation of the hardware information from any of the five mentioned monitors based on a selected time-scale. The CPU temperature reading supports values between 15 seconds and 15 minutes.
Let's head over to the settings. This opens in a pop-up window that has five tabs. The General tab allows you to set the side-bar placement (right/left), select the screen where it should be displayed (only for multiple monitor setups), and has options for auto-run at boot. The "always on top" toggle pins the side-bar on the screen; this can be useful if you want to check the hardware temperatures, memory usage, or CPU load while gaming or performing intense tasks.
The advanced tab lets you adjust some UI related options. The customize tab in Sidebar Diagnostics lets you choose the sidebar's width, background color and opacity. You can also set the text alignment, font size, font color here. This pane has the option to disable/enable the clock, and set the date format. In case of high usage levels, the program will blink and display the text in red to get your attention.
The monitors tab is the most useful one in the application. You can enable or disable each monitor from this screen. Now it may not seem obvious at first glance, but each of these monitors is customizable. To do so, mouse over one of the monitor's name and left-click on it. This lets you choose the settings for the selected monitor.
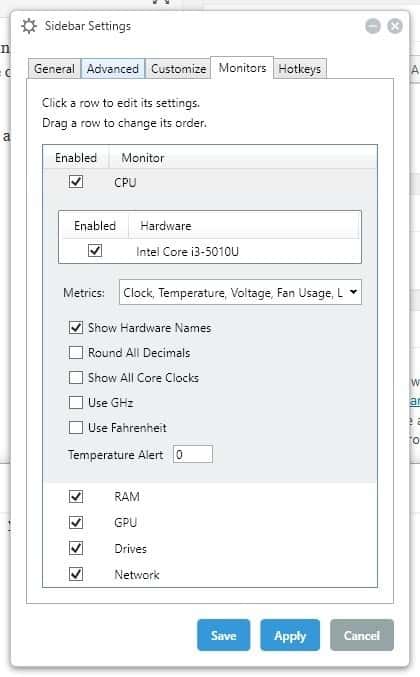
- CPU - Clock, Temperature, Voltage, Fan Usage, Load, Core Load
- RAM - Clock, Voltage, Load, Used, Free
- GPU - Core Clock, CRAM Clock, Core Load, VRAM Load, Voltage, Temperature, Fan Usage
- Drives - Load Bar, Load, Used, Free, Read Rate, Write Rate
- Network - IP Address, Bandwidth In, Bandwidth Out
You can set the CPU and GPU to use GHz and/or Fahrenheit instead of MHz and Celsius. The Hotkeys tab lets you bind your own shortcut keys for various functions such as toggling, showing, or hiding the side-bar.
Sidebar Diagnostics uses Open Hardware Monitor for gathering the data. So the limitations of the latter apply to the former as well.
Note: The interface could get clunky if you have a lot of drives/partitions. Uncheck some options to only see the information that you need. And in case you exit the application and are unable to use applications in full-screen mode, open the Windows Task Manager and restart the "Explorer" process.
Closing Words
Sidebar Diagnostics is a useful specialized application for Windows; it is especially useful to users and computer workers who need the hardware information, e.g. when troubleshooting the system or making sure that the temperature does not rise above certain levels.
Ghacks needs you. You can find out how to support us here (https://ift.tt/2pxfu0k) or support the site directly by becoming a Patreon (https://ift.tt/2YEosgX). Thank you for being a Ghacks reader. The post Sidebar Diagnostics is an open-source application that displays hardware information on your desktop appeared first on gHacks Technology News.
Post a Comment