What do you do when you feel that your computer is lagging? If you're like me, you will probably open the Task Manager to see what's wrong.
Usually, most users observe the CPU or RAM usage, and close any programs that maybe bogging down the system.
But sometimes your computer can experience a micro stutter when a program opens, or if your antivirus decides to run a scan randomly, and so on. It may be useful to know the resource usage at a glance, without running the Task Manager.
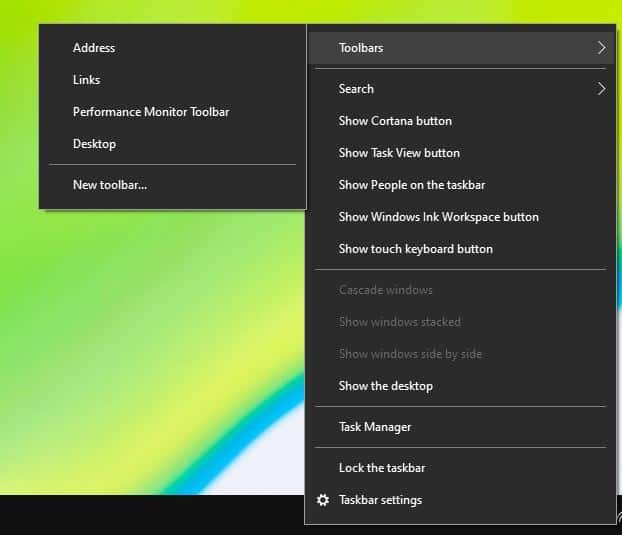
Perfmonbar is a tool can help you do that. Install the application, and right-click on the Taskbar. Navigate to the Toolbars menu and enable the Performance Monitor Toolbar. (refer to the image above)
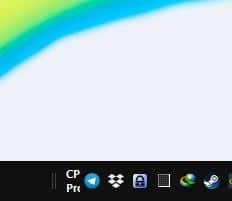
The toolbar will appear next to the system tray. It only has a couple of letters on it by default, which is not how it is supposed to look like. Mouse over the lines to the left of the toolbar, click and drag it to expand the deskband.
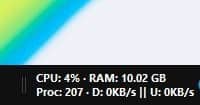
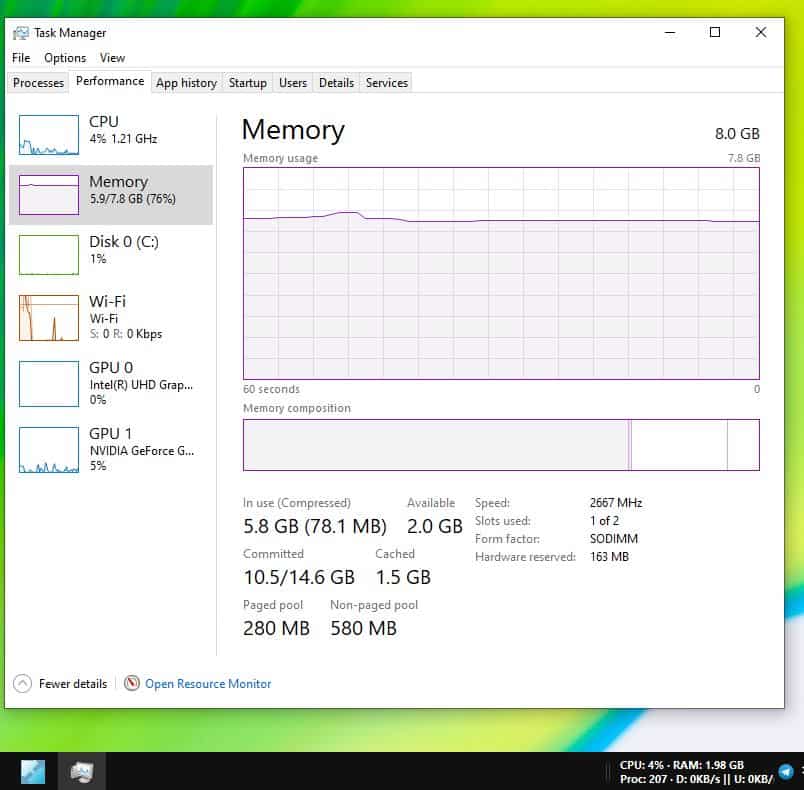
Perfmonbar displays 4 performance counters. One of these is for the CPU Usage, which is shown in percentage. The RAM usage is reported in Gigabytes. The issue here is that the memory usage shown by the toolbar is not just your physical memory, instead it is the Committed memory (that you can view from Task Manager > Performance > Memory). You can change this to show the available memory and more, we'll get back to this later.
The program tells you how many processes are running, both in the foreground and the background. The 4th counter is for the network, and displays the Download and Upload stats, in terms of KB/s (Kilobytes). By default, it is set to display the Ethernet adapter's usage. There is a fifth counter in Perfmonbar, and it is hidden. To view it, click on the toolbar and you will see the amount of storage space that is free on your computer's hard drive.

Perfmonbar uses Window's built-in Performance Monitoring Counters to display the stats in real-time. You can find all available counters supported by Windows with a simple command. Open CMD and enter the following typeperf -q>counters.txt. This will save the list of available counters in a text file in your Users folder.
The settings of Perfmonbar are stored in a Config.XML file. It is very customizable, and you can use it to modify the display font type, size, color, and also the counters that are displayed on the toolbar.
Let's make a couple of changes. I want the toolbar to show the available memory (instead of the commited memory). Open Perfmonbar's Config.XML in any text editor, you can do so by right-clicking on the toolbar and selecting "Edit configuration" and look for the line that says,
<counter name="mem" value="\Memory\Committed Bytes"/>
Change the value to \Memory\Available MBytes, so it should read,
<counter name="mem" value="\Memory\Available Bytes"/>
Hit the save button. If the toolbar is running, use the "Reload Configuration" from its menu. The toolbar will now display the amount of free RAM that is available.
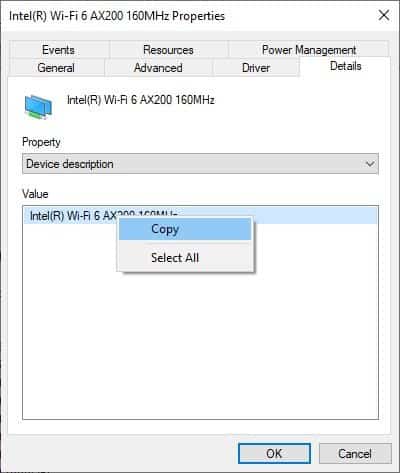
Let's change the network counter to display the current Wi-Fi usage instead of LAN. Open Windows' Device Manager, navigate to Network Adapters. Select your Wi-Fi adapter > Properties > Details. Right-click on the adapter's name in the value pane and select copy.
Paste it in the XML file, look for the counters that are named "netin" and "netout". There is one change that you will need to make to get it working. If your network adapter has parentheses (), replace them with square brackets [].
For e.g my adapter's name is an Intel(R) Wi-Fi 6 AX200 160MHz. I'll have to edit it, so the counter will look like
<counter name="netin" value="\Network Interface(Intel[R] Wi-Fi 6 AX200 160MHz)\Bytes Received/sec"/>
You can add and remove counters as you like by editing the Configuration file. Take a backup of the file before editing it.
Perfmonbar is an open source project. It is not portable.
Thank you for being a Ghacks reader. The post View the CPU, RAM and network usage on the Taskbar with Perfmonbar appeared first on gHacks Technology News.
إرسال تعليق